– Assistant Professor, Washington University St Louis
Aim: To assess alternative statistical methods for establishing robust flow cytometry crossmatch thresholds and to evaluate their clinical utility and continuous monitoring in HLA testing.
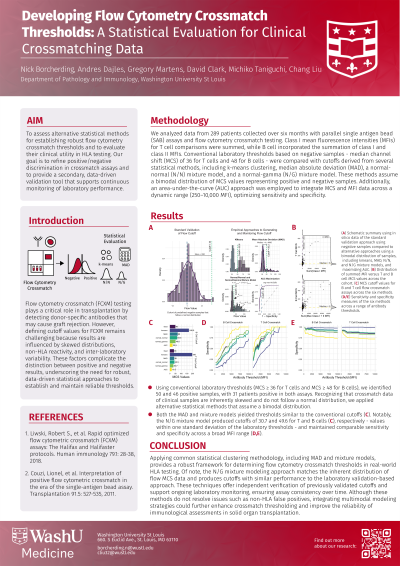
Methods: We analyzed data from 289 patients collected over six months with parallel single antigen bead (SAB) assays and flow cytometry crossmatch quantification. Summed class I mean fluorescence intensities (MFIs) for T cell comparisons, while B cells utilized the summation of class I and class II MFIs. Laboratory thresholds based on negative samples - median channel shift (MCS) of 36 for T and 48 for B - were compared with cutoffs derived from statistical methods, including k-means clustering, median absolute deviation (MAD), normal-normal (N/N), and normal-gamma (N/G) mixture models. These methods assume a bimodal distribution of positive and negative via MCS. Additionally, an area-under-the-curve (AUC) approach was employed to integrate MCS and MFI data across a dynamic range (250–10,000 MFI).
Results: Within our 289-patient cohort, the median MCS values were 6 and 5 for T and B cell crossmatching, respectively (B). Using conventional laboratory thresholds (MCS ≥ 36 and ≥ 48 for T and B), we identified 50 and 46 positive samples, with 31 patients positive in both assays. The k-means method, for instance, generated substantially higher cutoff values (166.9 for B and 196 for T, C), which increased sensitivity but reduced overall specificity (D,E). In contrast, the AUC-based approach produced lower cutoffs (23.5 for B and 16.5 for T, C), achieving the inverse in terms of sensitivity and specificity (D,E). Both the MAD and mixture models yielded thresholds similar to the conventional cutoffs (C). Notably, the N/G mixture model produced cutoffs of 30.7 and 49.6 for T and B (C), values within one standard deviation of the laboratory thresholds - and maintained comparable sensitivity and specificity across a broad MFI range (D,E).
Conclusion: Applying common statistical clustering methodology, including MAD and mixture models, provides a robust framework for determining flow cytometry crossmatch thresholds in real-world HLA testing. Of note, the N/G mixture modeling approach matches the inherent distribution of flow MCS data and produces cutoffs with similar performance to the conventional approach. These techniques offer independent validation of cutoffs and support ongoing laboratory monitoring, ensuring assay consistency over time.